


The last decade provided a pretty wild yet exciting ride for exchange-traded funds (ETFs). From the ETF industry crossing the $4B mark in AUM (assets under management) and the meteoric rise of ESG (Environmental Social and Governance) investing to the SEC approving the first-ever non-transparent, actively managed ETFs last year, the ETF space has not been short of landmark and historic events.
From just a handful of offerings a couple of decades ago, we’re now bombarded with a cornucopia of everything ETF: As of January 2020, the US ETF/ETP industry boasted 2,361 ETFs/ETPs, from 155 providers on 3 exchanges.
The ETF industry is now much bigger than the mutual fund industry thanks to investors increasingly shunning actively-managed funds and flocking to passive funds.
That’s the case because ETFs really take the benefits of mutual fund investing to the next level. They frequently offer lower operating costs than traditional open-end funds, more flexible trading, greater transparency, and even better tax efficiency for taxable accounts. Most financial experts agree that these advantages significantly outweigh ETF drawbacks such as higher trading costs as well as a steeper learning curve.
Yet, experts believe that this could merely be the beginning for the industry thanks mainly to a less arduous regulatory regime by the SEC including last year’s watering down of its exemptive relief rule.
Top performing ETFs
When looking at stock market sector returns over the past decade, one notable trend stands out: Technology was king.
Another interesting trend: Just five tech companies namely Microsoft Inc. (NASDAQ:MSFT), Apple Inc.(NASDAQ:AAPL), Amazon Inc. (NASDAQ:AMZN), Alphabet Inc.(NASDAQ:GOOG) and Facebook Inc.(NASDAQ:FB) have been hogging the limelight (and investor dollars). The five have enjoyed phenomenal growth over the past decade so much so that they now represent nearly 20% of the S&P 500’s aggregate market capitalization.
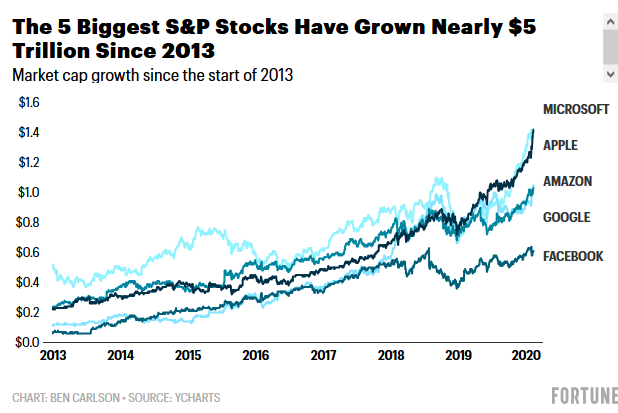
Source: Fortune
Not surprisingly, tech-focused ETFs dominated the catalog of the best performers. The Top 25 ETFs were all able to provide annualized returns exceeding 15%, with the biggest semiconductor ETF, SOXX, taking pole position after returning more than 19% a year on average over the past decade.
Here’s a rundown of the best performing ETFs from 2010-2019.
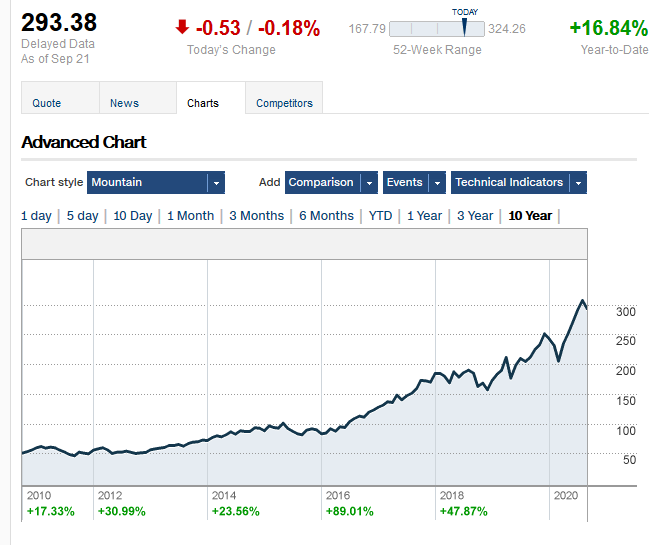
#1 iShares PHLX Semiconductor ETF
AUM: $3.74B
Expense Ratio: 0.46%
10-Year Annualized Returns: 19.07%
10-Year Total Returns: 547.85%
Source: CNN Money
The iShares PHLX Semiconductor ETF(SOXX) is an exchange traded fund launched by BlackRock, Inc. SOXX mainly tracks companies operating across the information technology (IT), semiconductors and semiconductor equipment sectors. The fund focuses on U.S. stocks, but also invests one-quarter of its assets in international firms, thus giving it relatively balanced exposure.
SOXX is the largest semiconductor ETF, with second-placed VanEck Vectors Semiconductor ETF (SMH), commanding $2.68B in AUM.
The fund’s top 5 holdings as of September 2020 are:
- Nvidia Corp.(NASDAQ:NVDA)–9.84%
- Qualcomm Inc.(NASDAQ:QCOM)–9.61%
- Texas Instruments (NASDAQ:TXN)–7.82%
- Broadcom Inc.(NASDAQ:AVGO)–7.78%
- Advanced Micro Devices (NASDAQ:AMD)–5.51%
SOXX was the best-performing ETF over the last decade, providing a juicy 19.07% annualized return. SOXX has also proven to be that rare all-weather ETF play, managing to post positive returns in all but one year since 2010, a trend that has carried on to the 2020s with a 16.84% YTD gain.
With SOXX’s top companies like Nvidia, Broadcom and AMD sitting squarely on megatrends such as 5G, AI and IoT, this fund could be set to continue to outperform for years to come.
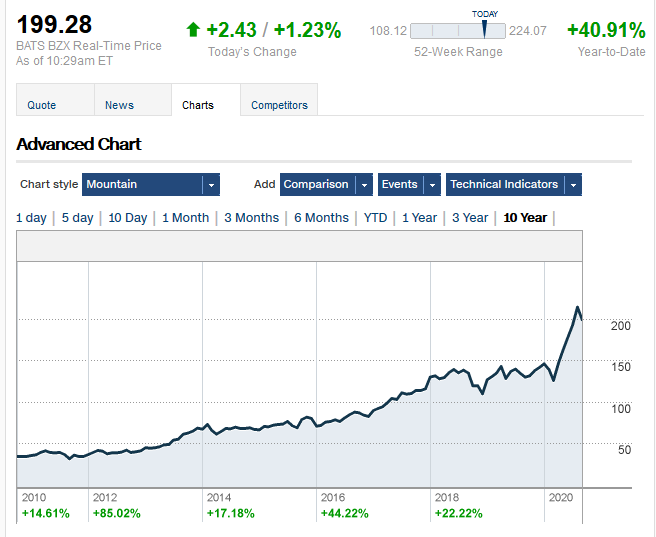
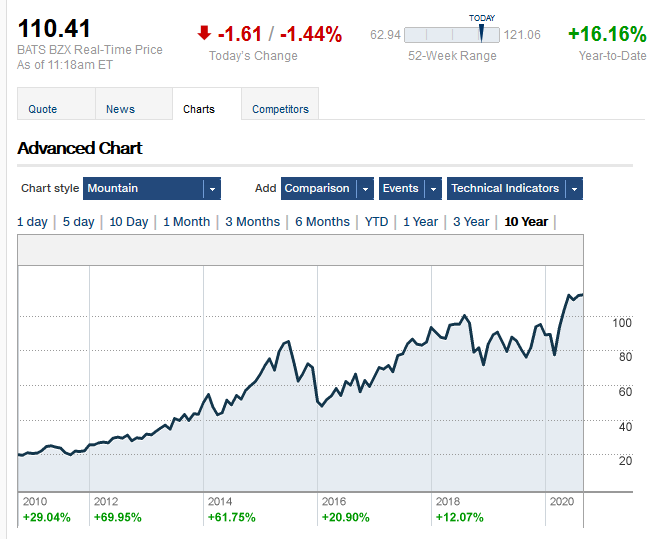
#2 First Trust Dow Jones Internet Index Fund
AUM: $10.29B
Expense Ratio: 0.52%
10-Year Annualized Returns: 18.52%
10-Year Total Returns: 512.69%
Source: CNN Money
The First Trust Dow Jones Internet Index Fund (FDN) is a composite of two sub-indices; the Dow Jones Internet Commerce Index and the Dow Jones Internet Services Index. FDN is designed to measure the performance of the largest and most actively traded stocks in the United States’ Internet industry. The fund invests in stocks of companies operating across the IT, internet, internet software, services and infrastructure sectors.
FDN’s top holdings are:
- Amazon Inc. (NASDAQ:AMZN)–10.54%
- Facebook Inc.(NASDAQ:FB)–7.55%
- Salesforce.com (NYSE:CRM)–5.80%
- Paypal Holdings (NASDAQ:PYPL)–5.26%
- Netflix Inc.(NASDAQ:NFLX)–5.06%
FDN is, by far, the largest internet ETF, with second-rated iShares Expanded Tech-Software Sector ETF (IGV), managing less than half its AUM at $4.88B. Nearly 70% of FDN’s holdings are tech stocks, with Amazon and Netflix accounting for the bulk of the ETF’s ~19% consumer cyclical exposure.
Most of FDN’s constituents are growth or momentum stocks, led by the fabled FAANG group. The phenomenal decade-long run by FAANG has left FDN looking quite pricey with an average price-to-earnings ratio of 35.5, well above the median PE of 14.8 by the S&P 500. This implies that FDN might continue to beat the market in the coming years but by a smaller margin of outperformance especially with the ESG megatrend rapidly gaining the upper hand.
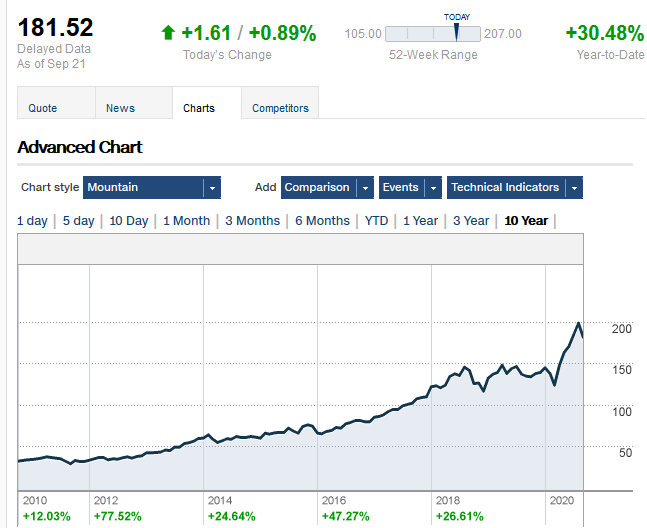
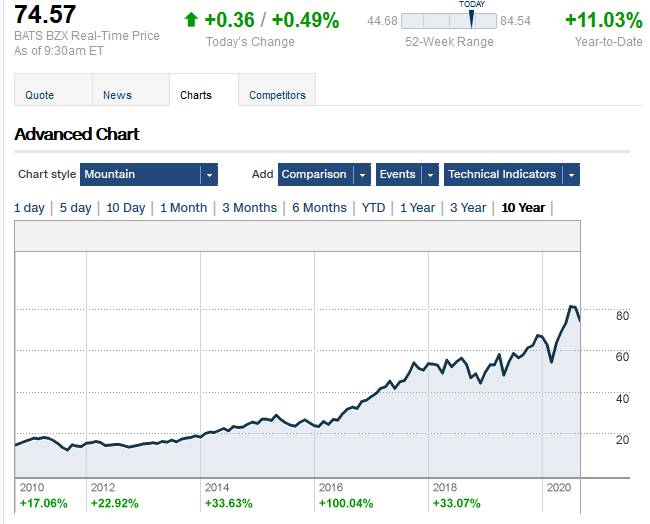
#3 Invesco NASDAQ Internet ETF
AUM: $824.02M
Expense Ratio: 0.60%
10-Year Annualized Returns: 18.45%
10-Year Total Returns: 532.39%
Source: CNN Money
The Invesco NASDAQ Internet ETF (PNQI) is an index designed to track the performance of (before fees and expenses) of the NASDAQ Internet Index. These are mainly internet-related businesses that are listed on U.S. stock exchanges. These include companies that specialize in internet software, internet search engines, web hosting, internet retail commerce or website design.
PNQI’s top holdings are:
- Amazon Inc.–8.61%
- Alibaba Group (NYSE:BABA)–8.44%
- Adobe Inc.(NASDAQ:ADBE)–8.09%
- Facebook Inc.–7.94%
- Alphabet Inc.(NASDAQ:GOOG)–6.97%
Over the past two years, this Invesco ETF has been beating FDN while also being significantly less volatile. The same trend has continued in the current year with PNQI outperforming FDN by quite some margin. That’s the definition of superior risk-adjusted returns.
A big reason why this internet fund has been trouncing its much bigger peer is that it includes successful, foreign-based internet firms such as Alibaba and Shopify (NYSE: SHOP), a script that many US-focused internet ETFs are unable to follow due to index requirements.
Another of its top secrets–PNQI offers ample e-commerce exposure, a potent, secular megatrend that is likely to rule many more years–if not decades–to come.
#4 SPDR S&P Biotech ETF
AUM: $5.32B
Expense Ratio: 0.35%
10-Year Annualized Returns: 18.40%
10-Year Total Returns: 494.45%
Source: CNN Money
The SPDR S&P Biotech ETF (XBI) is one of a handful of biotech ETFs available in the market. XBI is designed to track the performance of the S&P Biotechnology Select Industry Index and provide exposure to pharmaceuticals, health care, biotechnology and life sciences sectors. Biotech is a corner of the market that’s capable of big jumps during events of major drug approvals and can also perform well during periods of consolidation.
XBI’s top holdings are:
- Novavax Inc. (NASDAQ:NVAX)–2.40%
- Invitae Corp. (NYSE:NVTA)–2.14%
- Aimmune Therapeutics Inc.(NASDAQ:AIMT)–1.78%
- Momenta Pharmaceuticals Inc.(NASDAQ:MNTA)–1.66%
- Emergent Bio Solutions Inc.(NYSE:EBS)–1.64%
XBI focuses primarily on mid-and-small-cap U.S. securities.This implies it might be too precise for investors seeking to construct a long-term portfolio. Nevertheless, the fund can be useful for investors who are bullish on the sector over the long run or for those seeking to fine tune exposure to the sector.
#5 Invesco Dynamics Semiconductor ETF
AUM: $259.74M
Expense Ratio: 0.57%
10-Year Annualized Returns: 18.01%
10-Year Total Returns: 526.84%
Source: CNN Money
The semiconductor industry has been red-hot over the past four years, and Invesco Dynamics Semiconductor ETF(PSI) is another sector ETF that has been flying. Just like SOXX, PSI invests primarily in companies that manufacture semiconductor chips that power our electronics including smartphones, computers, iPads, calculators, and much more. However, PSI differs from SOXX in one aspect: It only invests in U.S.-based chip companies thus giving investors pure domestic exposure to the U.S. chip industry. It’s top holdings, however, closely mirror SOXX’s but with different weightings.
Leading PSI stocks include:
- Advanced Micro Devices–7.32%
- Nvidia Corp.–6.57%
- Qualcomm Inc.–6.36%
- Texas Instruments–5.11%
- Broadcom Inc.–5.11
Another important difference: PSI mainly invests in medium-and small-cap stocks, meaning it provides stronger growth opportunities but can also be more volatile than a traditional large cap fund like SOXX.


