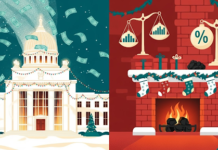
The Lights Are On, But What Do We See?
Washington is back online, and the data printers are warming up after the longest government shutdown in history. For 43 days, it felt like economists were trying to navigate a blizzard without a map, relying on patchy private reports and squinting at jobless claims. The government reopening feels like the lights coming back on, revealing a room that has not completely fallen apart. That’s the good news. The U.S. economy seems to have weathered the political stalemate without collapsing.
But as we detail in today’s main topic, “surviving” is not the same as “thriving.” The shutdown created a data black hole, and what we do know is concerning. Persistent inflation remains a major headache, and the labor market, while not breaking, is certainly cooling. This strange combination of low unemployment but slowing hiring creates a complex picture for investors.
We will explore this “two-speed” economy and what the data gap means for the Federal Reserve. This week is all about looking past the surface noise to see the real structure underneath.
This Week I Learned…
The Art and Science of Economic Data
This week, the market was reminded just how much it relies on a steady stream of government data. The 43 day shutdown created a data vacuum, forcing analysts to fly blind. This brings up a great question: where does all this data, like the Consumer Price Index (CPI) or jobless claims, actually come from?
This week I learned about the massive logistical effort behind these economic indicators. Take the CPI, our key inflation gauge. It is not just a survey. The Bureau of Labor Statistics (BLS) employs hundreds of “economic assistants” who physically visit or call thousands of retail stores, service businesses, and housing units across the country to collect prices on a “market basket” of about 80,000 items. This is old school, boots on the ground data collection.
Jobless claims, which were available, are a different beast. They are a joint federal state program. When someone is laid off, they file a claim with their state’s workforce agency. The states then compile this data and report it to the Department of Labor, which aggregates and releases the national number every Thursday. Because the states continued to process claims, this data pipeline remained open.
Understanding this process highlights why the shutdown was so disruptive. The data is not automatic; it requires a vast, active workforce to gather. Without the BLS collecting price data or the Census Bureau conducting retail surveys, we are missing the core inputs for modeling the economy. The private reports we used as substitutes are helpful, but they often lack the comprehensive scope and methodological rigor of the official government statistics.
The Fun Corner
Data Points and Punchlines
With economists staring into a “data black hole” for 43 days, it brings to mind the old market saying: “A ‘consensus forecast’ is just the average of everyone’s most recent mistake.”
Here is a bit of market trivia that highlights how data can be quirky. Did you know about the “Good Housekeeping” stock indicator? In 1984, an analyst proposed that a bear market was imminent when the magazine’s cover featured only a celebrity, with no secondary “blurb” headlines. Conversely, a cover cluttered with blurbs signaled a bull market. His theory was that cluttered covers meant the magazine had to work harder to sell, indicating consumer caution (a bearish sign), while a simple celebrity cover implied high consumer confidence.
While it had a brief, oddly accurate run, it falls into the category of spurious correlations, like the “Super Bowl Indicator.” It is a humorous reminder that markets despise a vacuum. When official data disappears, as it did during the shutdown, investors will look anywhere for a sign, even if it is on the magazine rack.
Beyond the Reopening: An Economy of Contradictions
The federal government has reopened, ending a 43 day impasse. The consensus among economists is that the U.S. economy managed to avoid significant immediate damage. This assessment, however, comes with a large asterisk. The shutdown created a “data black hole” from October through mid November, forcing analysts to rely on limited information, primarily weekly jobless claims.
Encouragingly, these claims remained low. They registered 218,000 before the shutdown and hovered near 228,000 recently. This suggests the labor market did not experience a sharp weakening during the closure. This resilience is critical, as the ongoing expansion relies heavily on low unemployment, which stood at 4.3% pre-shutdown.
Yet, this stability masks deeper concerns. Hiring has slowed considerably since the spring, making new job searches more difficult. While some high-profile layoffs have been announced, they have not yet translated into a major spike in claims. Jeffrey Schmid, president of the Kansas City Fed, suggests this cooling might be structural, citing baby boomer retirements and decreased immigration shrinking the available workforce, rather than just a cyclical slump.
The economy’s other major vulnerability is persistent inflation. Price increases, partially fueled by tariff hikes, are running at a 3% annual rate, significantly above the Federal Reserve’s 2% target. While private reports suggested stable prices during the shutdown, the full impact of tariffs may not be realized yet.
This lingering inflation complicates the Fed’s next move. The prospect that the central bank might pause its rate cuts in December contributed to a market selloff as the shutdown concluded.
This all points to a bifurcated economy. Upper-income households, bolstered by the long bull market, continue to spend. Conversely, middle and lower-income Americans face increasing financial strain, cutting back on spending or falling behind on payments. The U.S. has maintained growth on this “two-speed” foundation, but any prolonged market downturn could upset this fragile balance. A full verdict on the shutdown’s impact awaits the release of postponed government reports.
The Last Say
Navigating the Fog
The end of the government shutdown closes one chapter of uncertainty, only to open another. While the immediate economic fallout appears contained, the 43-day pause in government operations has left investors and analysts in a fog. We are now awaiting a deluge of delayed reports on hiring, sales, and inflation. This data dump will be crucial in determining whether the economy’s foundations are as stable as the low jobless claims suggest, or if the “two-speed” economy is showing deeper fractures.
The market’s slight downturn upon the reopening was telling. It signals that investors are less concerned with the shutdown itself and more concerned with the pre-existing conditions it obscured: stubborn inflation and a cooling labor market. These are the factors that will genuinely influence the Federal Reserve’s path. The central bank must now navigate using a map that is a month and a half out of date.
For investors, the key takeaway is the importance of looking beyond the headlines. The shutdown was disruptive, but the underlying structural issues, from a shrinking workforce to the divergent fortunes of consumers, are the trends that will define the market environment heading into the new year. The real risk was not the shutdown, but what the shutdown forced us to ignore. Now, the market must play catch up, and that process is rarely smooth.


